The Simple Math Behind Energy Usage
Every appliance in your home has a wattage rating. That number, multiplied by the hours it runs, divided by 1,000, gives you kilowatt-hours (kWh). Multiply kWh by your electricity rate and you know exactly what that appliance costs you.
Here's the formula in its entirety: Watts — Hours Used — 1,000 = kWh. kWh — Rate = Cost. That's it. That's the entire calculation.
Let's do a real example. A 1,500-watt space heater running for 6 hours: 1,500 — 6 = 9,000 watt-hours — 1,000 = 9 kWh. At $0.172/kWh, that's $1.55 per day. Run that heater every day for a 90-day winter: $139.50. Now you know exactly what that space heater costs you for the season.
Most people have no idea their $40 space heater costs $140 to operate. That's the gap this calculation fills. Once you know the numbers, every energy decision becomes a financial calculation instead of a guessing game.
The wattage of any appliance is listed on its label — usually on the back or bottom. If you can't find it, the Department of Energy publishes average wattages for over 60 common household appliances. I keep a reference sheet on my phone for quick checks.
💡 Key Insight
The average US household uses 899 kWh per month (EIA 2025). At $0.172/kWh, that's $154.63/month or $1,855/year. If your usage is above 1,100 kWh/month, you're in the top 25% of consumers and almost certainly have savings opportunities.
Your Biggest Energy Hogs (Ranked)
Based on measured data from thousands of homes, here's the ranking of residential energy consumers from highest to lowest. These are average annual kWh figures for a typical US home:
- Heating and cooling (HVAC): 4,500-9,000 kWh/year (42-47% of total). This is by far the largest category. The range is enormous — a well-insulated home with a heat pump in Virginia uses 3,500 kWh for HVAC. A poorly sealed home with an old AC unit in Arizona uses 14,000 kWh.
- Water heating: 3,000-4,500 kWh/year (14-18%). Electric water heaters are the second-largest energy user. Gas water heaters don't appear on your electric bill, obviously, but the hot water they produce still costs money.
- Refrigerator: 400-800 kWh/year (5-8%). A 2026 ENERGY STAR fridge uses about 350 kWh/year. A 15-year-old model uses 700-900 kWh. That alone is a $60-$90/year difference.
- Clothes dryer: 600-1,000 kWh/year (5-8%). Electric dryers are energy-intensive. Each load uses 2-5 kWh depending on size and moisture content.
- Lighting: 300-700 kWh/year (4-6%). This has dropped dramatically with LED adoption. Homes still using incandescent bulbs can be at 1,000+ kWh for lighting alone.
- TV and media equipment: 200-500 kWh/year (3-5%). Large OLED TVs are surprisingly efficient (80-150 watts), but cable boxes and sound systems add up.
- Computers and office equipment: 150-400 kWh/year (2-4%). Desktop computers use far more than laptops. A gaming PC can draw 400-800 watts while gaming.
- Cooking (oven, stove, microwave): 150-300 kWh/year (2-3%). Surprisingly small. Cooking simply doesn't use that much energy compared to HVAC.
- Dishwasher: 200-350 kWh/year (2-3%). Modern dishwashers are quite efficient. The energy mostly goes to heating water.
- Miscellaneous (everything else): 500-1,500 kWh/year (8-15%). This category includes pool pumps, well pumps, dehumidifiers, air purifiers, and all the phantom loads we discussed earlier.
How to Read Your Electricity Meter
Understanding your electricity meter gives you real-time insight into your home's energy consumption. There are three types of meters in use in 2026:
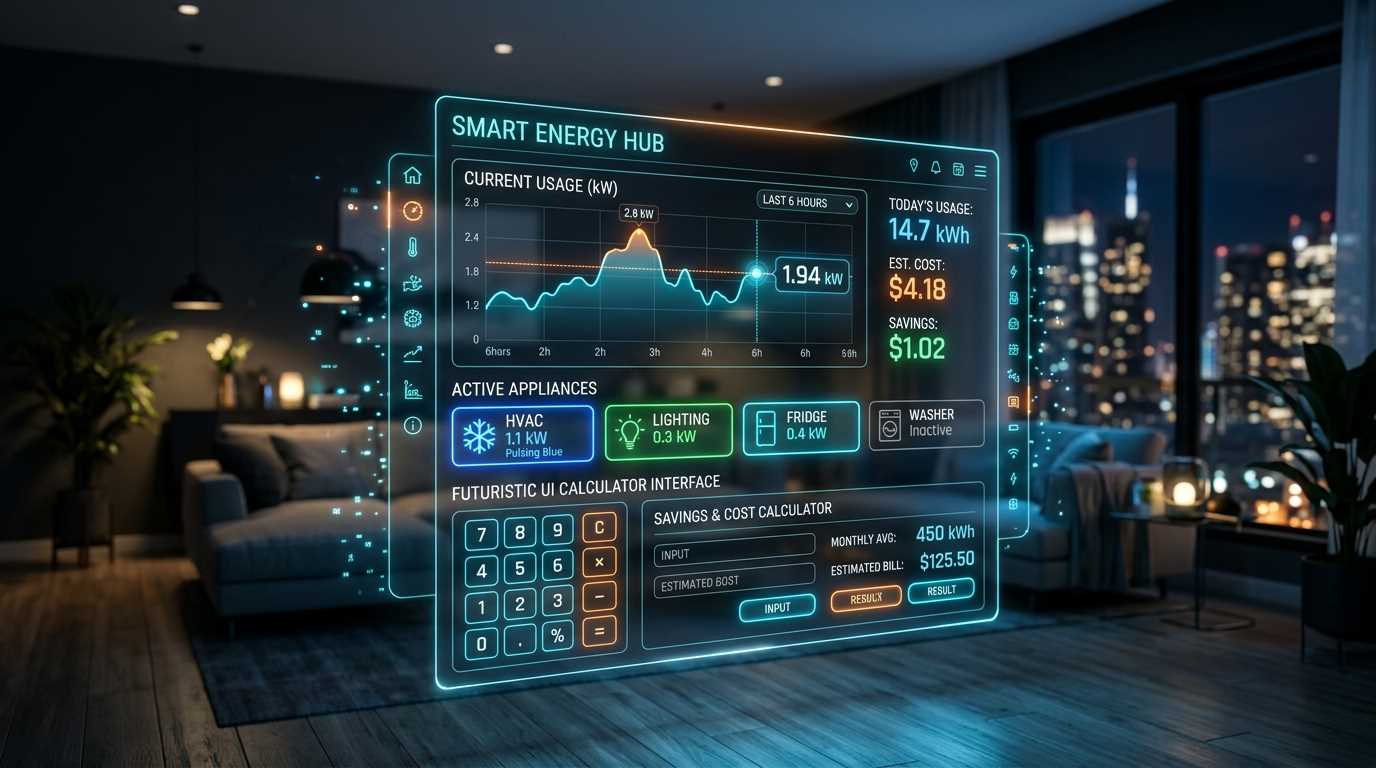
Digital smart meters (most common): These display your current power draw in kW. If it reads 3.2, your home is currently using 3.2 kW (3,200 watts). To see the impact of turning off an appliance, note the meter reading, turn the appliance off, wait 30 seconds, and check again. The difference is that appliance's actual draw. I do this exercise with every new client — the look on their face when they see the AC compressor kick on and the meter jump from 1.2 kW to 5.8 kW never gets old.
Analog dial meters (older homes): Read from left to right. Each dial rotates in alternating directions (clockwise, counterclockwise, clockwise). If the pointer is between two numbers, record the lower number. If it appears to be exactly on a number, check the dial to the right — if that dial hasn't passed zero yet, use the lower number. It's fiddly but accurate once you get the hang of it.
Smart meter portals: Many utilities now offer real-time usage data through their apps or websites. These show usage in 15-minute intervals and are far more useful than a physical meter reading. If your utility offers this, enable it immediately. It's free and it transforms your understanding of your home's energy patterns.
🔧 Pro Tip
- Do a "whole-house shutoff test." Turn off your main breaker for 2 minutes, note the meter reading (should be zero), then turn it back on and watch the reading. This confirms your meter is measuring correctly and helps you identify your home's baseline load — everything that's running right now. A baseline above 500 watts means you have significant phantom loads.
- Check your meter at the same time every day for a week. You'll quickly see which times of day your usage peaks.
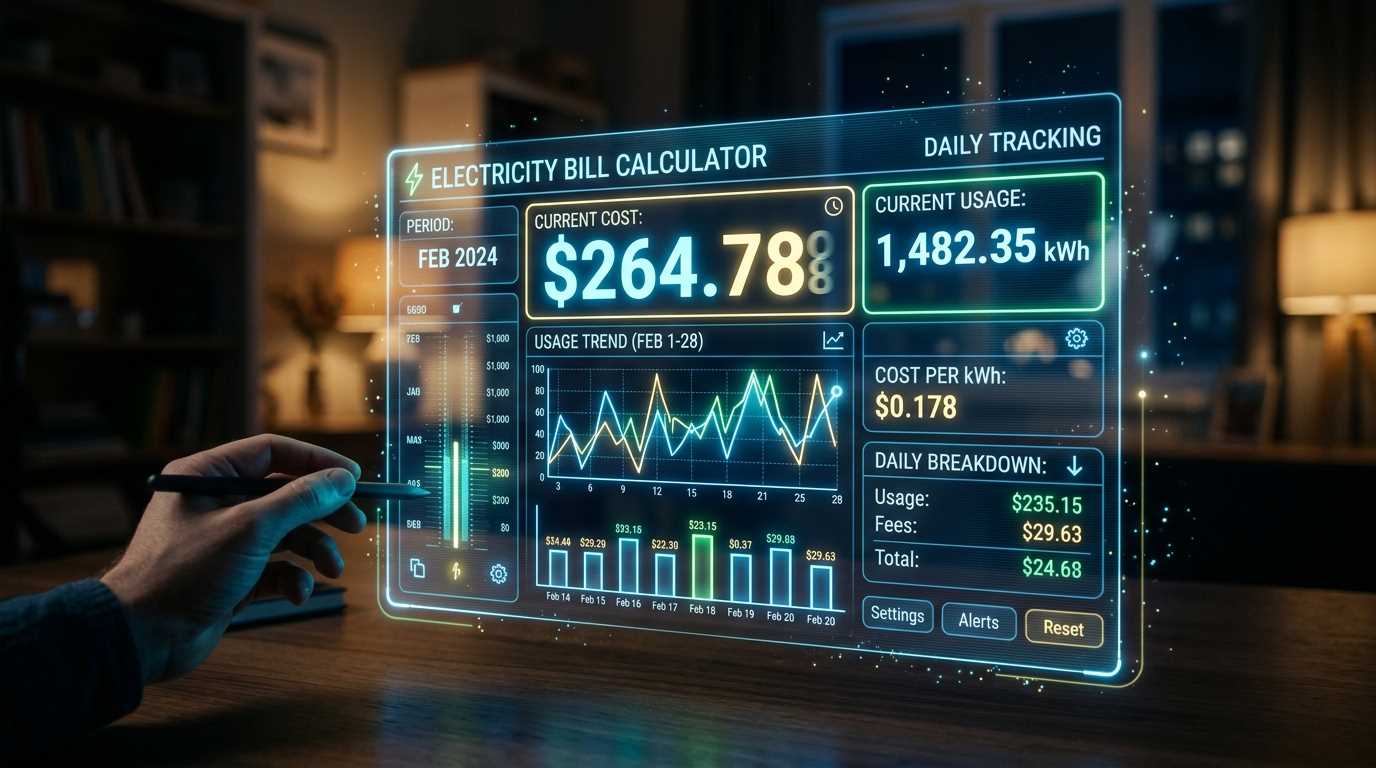
Using Our Home Energy Calculator
Our home energy calculator simplifies the whole process. Instead of manually calculating watts — hours for every appliance, you enter your monthly bill amount, home size, number of occupants, and major appliances. The calculator uses regional data and appliance databases to estimate your usage breakdown. Try our home energy usage calculator to get started.
Here's the process for the most accurate results:
- Have your last 12 months of electricity bills ready. Enter the average monthly kWh.
- Enter your home's square footage, year built, and insulation quality (good/fair/poor).
- List your major appliances: HVAC type and age, water heater type, refrigerator age, laundry equipment.
- Enter your electricity rate (from your bill: total cost — total kWh).
The calculator returns an estimated breakdown by category, a comparison to similar homes in your area, and a prioritized list of savings opportunities. It takes about 5 minutes to complete and gives you a clearer picture of your energy usage than most people have after years of paying bills.
Room-by-Room Energy Audit
Once you've got the big picture from the calculator, do a physical walkthrough. Grab a notepad and go room by room. Here's what to look for:
Kitchen: Refrigerator age and condition (feel the seals — if they're not magnetic-strong, they're leaking cold air). Oven and stove usage frequency. Dishwasher age and whether you use the heated-dry setting. Count the under-cabinet lights. Check if the refrigerator coils on the back are dusty (dirty coils make it work 25% harder).
Living room: TV size and hours of daily use. Number of devices plugged in (cable box, game console, sound system, streaming devices). Number of lights and bulb types. Any space heaters running? Ceiling fan direction and speed settings.
Bedrooms: TVs in bedrooms (each one is 100-200 kWh/year including standby). Phone chargers always plugged in. Space heaters or window AC units. Closet lights left on.
Bathrooms: Exhaust fan usage (they draw 10-50 watts and are often left running for 30+ minutes). Hair dryer and curling iron usage (minimal annual impact but high instantaneous draw). Any heated towel racks or radiant floor heating.
Laundry room: Dryer vent condition (is it clogged? Feel the exhaust outside while the dryer runs — airflow should be strong). Washer water temperature settings. Dryer usage frequency.
Garage/Basement: Secondary refrigerator or freezer. Dehumidifier usage (a big one — dehumidifiers use 300-700 watts continuously when running). Water heater location and insulation. Any workshop tools left plugged in.
Outdoor: Pool pump (the single most energy-intensive outdoor device — 1.5-3 HP running 6-12 hours daily = 9-36 kWh/day). Outdoor lighting. Sprinkler system controller. EV charger.
Seasonal Usage Patterns
Energy usage is highly seasonal in most climates. Understanding your seasonal pattern helps you plan ahead and avoid bill shock:
- Summer peak (June-September): HVAC dominates. In hot climates, AC can be 60-70% of total summer usage. A 2,000 sq ft home in Texas might use 1,800 kWh in August vs. 600 kWh in March — a 3x difference.
- Winter peak (December-February): Electric heating homes see their highest bills. Heat pumps are efficient but still consume 2-3x more in January than in October. Homes with electric resistance heat (baseboard heaters) can see bills 4-5x higher than shoulder seasons.
- Shoulder seasons (March-May, October-November): Lowest usage for most homes. Minimal heating and cooling needed. This is the best time to do energy upgrades — your usage is low enough that you can experiment with changes without discomfort.
💡 Key Insight
Track your monthly kWh for a full year and you'll see your personal seasonal pattern. Most people's highest month is 2.5-4x their lowest month. The ratio tells you about your climate dependency: a ratio under 1.5 means you live in a mild climate or have an extremely efficient home. A ratio over 3 means your HVAC is driving massive seasonal swings.
Benchmarking Against Similar Homes
Knowing your usage is useful. Knowing how it compares to similar homes is actionable. The EIA's Residential Energy Consumption Survey (RECS) provides the best national benchmark data. Here's how typical 2025-2026 usage breaks down by home size:
- Under 1,000 sq ft: 450-650 kWh/month average
- 1,000-1,500 sq ft: 650-900 kWh/month average
- 1,500-2,000 sq ft: 900-1,200 kWh/month average
- 2,000-2,500 sq ft: 1,100-1,500 kWh/month average
- Over 2,500 sq ft: 1,400-2,000+ kWh/month average
Climate matters enormously. A 1,500 sq ft home in San Diego averages 500 kWh/month. The same home in Phoenix averages 1,200 kWh/month. The same home in Minneapolis averages 900 kWh/month. When you benchmark, compare against homes in your climate zone, not the national average.
Many utilities now provide a "home energy report" that compares your usage to 100 similar homes in your area. These reports typically include a smiley face rating (you're better than average, average, or worse than average). Take them seriously — households that receive these reports reduce their usage by an average of 2-4% simply from the social comparison effect.
Creating Your Reduction Plan
Armed with your usage data, benchmark comparison, and room-by-room audit, here's how to build a realistic reduction plan:
Week 1: Implement all the free behavioral changes. Adjust thermostats, unplug vampire devices, change laundry habits, turn off unused lights. This costs nothing and typically saves 5-10%. For more targeted strategies, check my guide on practical ways to cut electricity bills.
Weeks 2-4: Spend $50-$150 on quick-win upgrades: LED bulb replacements, weatherstripping, smart power strips, door sweeps, foam outlet gaskets. These save another 5-10%.
Month 2-3: Invest in a smart thermostat ($120-$250) and program it properly. This saves another 10-15% on HVAC costs. If your water heater is over 10 years old, start researching replacements.
Months 4-12: Plan your larger investments: insulation upgrades, appliance replacements, or solar panel installation. Use the savings from weeks 1-3 to help fund these. Run everything through an energy savings calculator first to verify the payback period makes sense. Check our insulation ROI calculator to see if upgrading your home's insulation is worth the investment.
The key is sequencing. Don't buy solar panels to offset the energy waste from a 15-year-old refrigerator and single-pane windows. Fix the cheap stuff first, then size your big investments to your reduced baseline.
🔧 Pro Tip
- Set a goal of reducing your usage by 15% in the first 90 days. This is achievable for most homes without major investments and without any meaningful comfort sacrifice.
- Re-run the home energy calculator after each phase of upgrades. The before/after comparison is motivating and helps you verify that your changes are actually working.